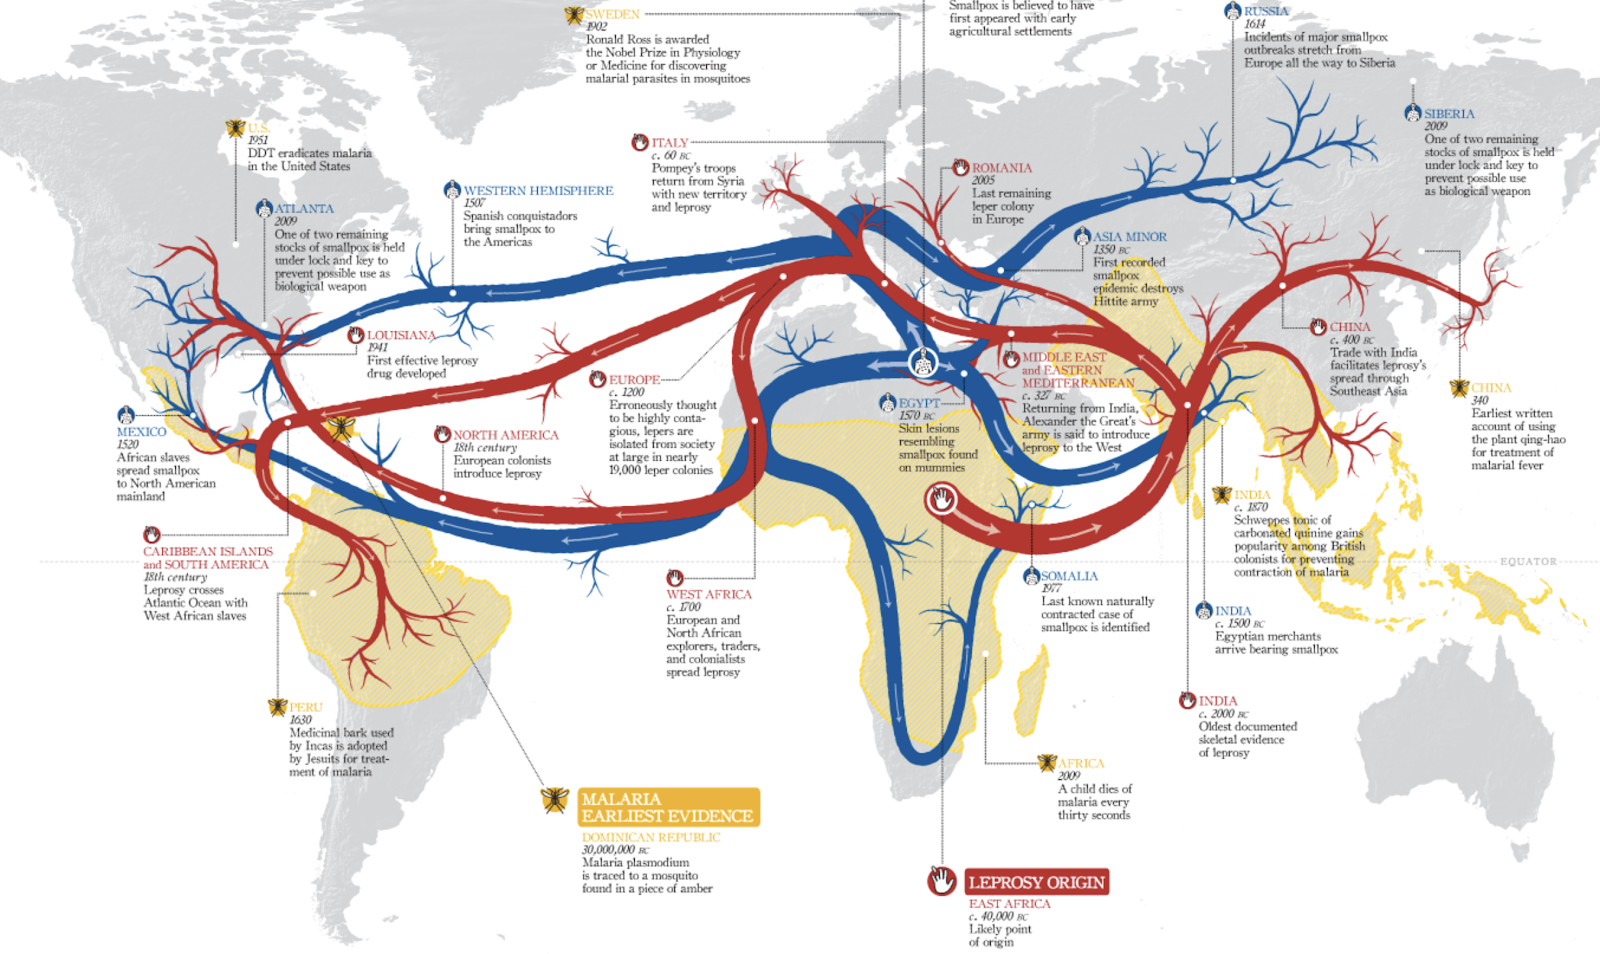
Figure 1. Flow Map - Spread of Disease
About Flow Map
The flow map is one of common thematic maps.
It represents the direction and/or magnitude of a certain occured phenomenon along linear objects or between locations. (Golebiowska, I., Korycka-Skorupa, J., and Slomska-Przech, K., 2021)
This map uses visual variables color hue, size, and color value
to visualize qualitative an/or quantitative data in the form of direction, quality, and magnitude of movement (Steiner, E., 2019).
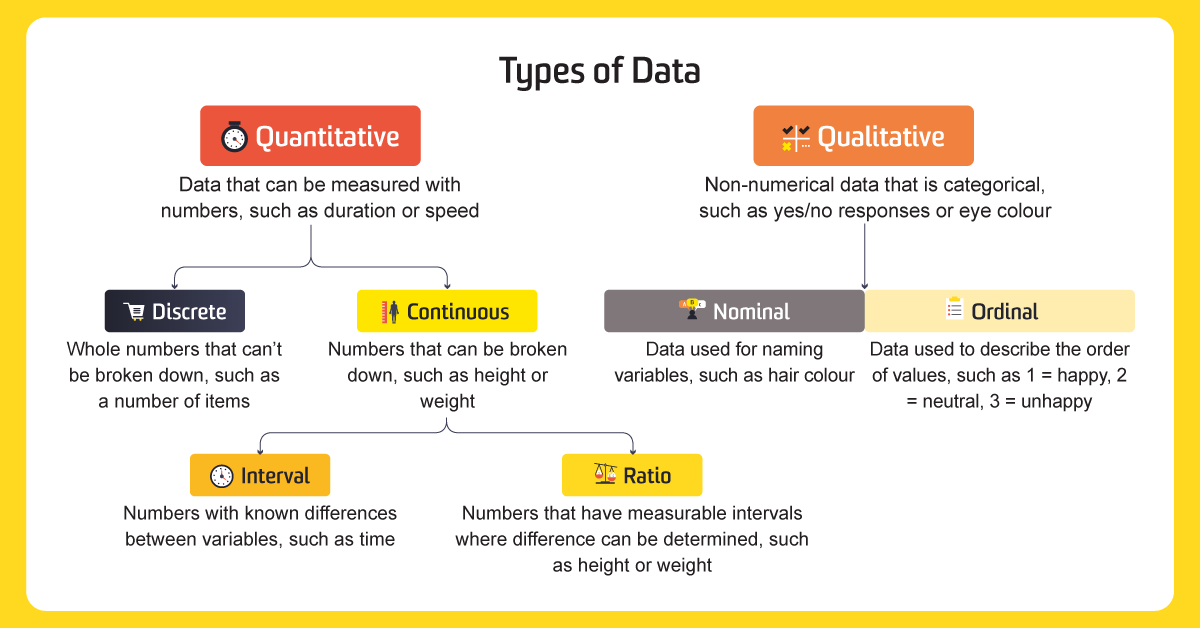
Figure 2. Data Types
Flow Map Data
We have learned about data type shown in Figure 2. Flow map is flexible and able to represent both Qualitative Data and Quantitative Data
The examples of Quantitative data which can be visualized with Flow Map:
→ Total import and export, Total migration, World trade flow
The examples of Qualitative data which can be visualized with Flow Map:
→ Types of export and import commodities, Animals migration direction, River or stream flow, Wind flow
Flow Map Categories
From Figure 3 below we can see that there are 3 categories of flow map, namely radial, network, and distributive.
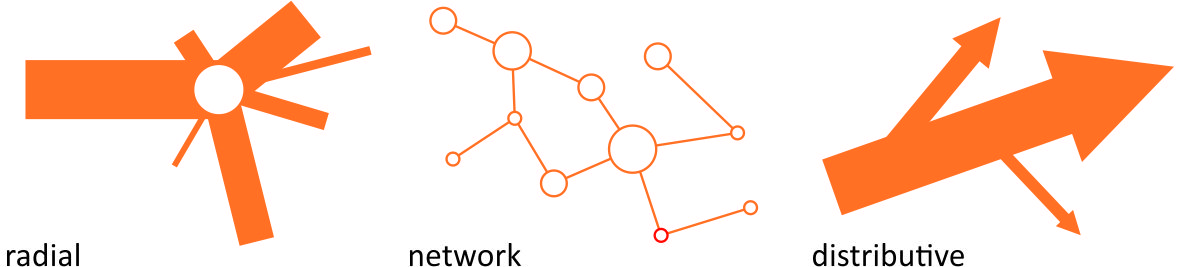
Figure 3. Flow Map Categories from
Golebiowska, I., Korycka-Skorupa, J., and Slomska-Przech, K. (2021)
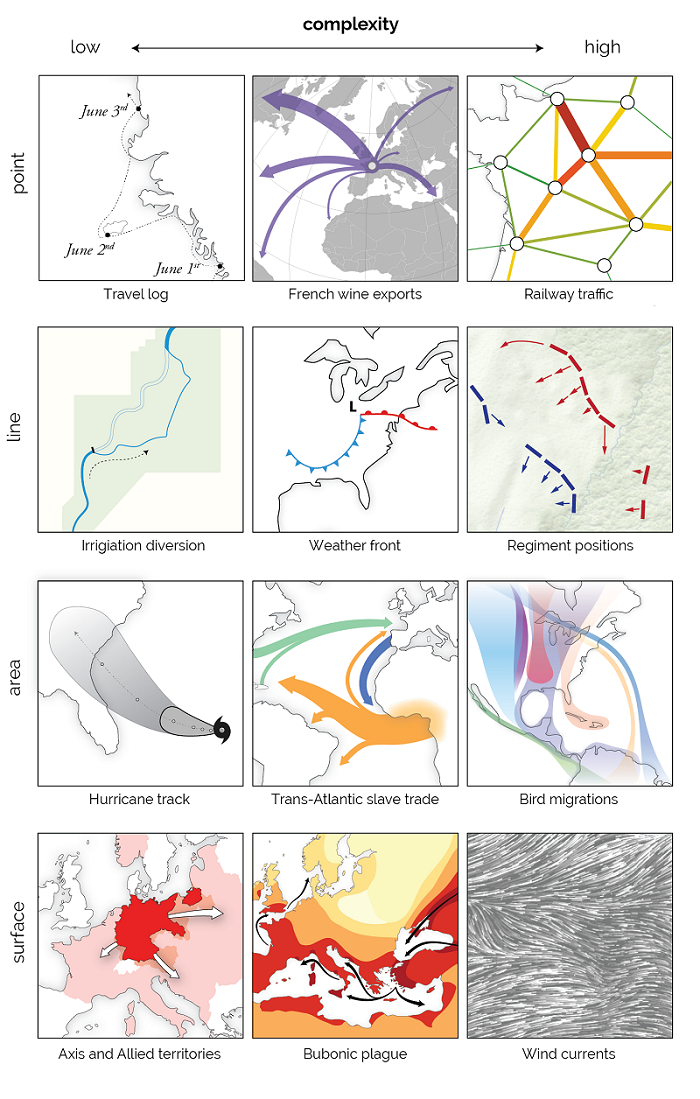
Furthermore, Figure 4 shows the typology of flow map from low to high complexity. From this figure we can conclude that flow map can be used for visualizing point, line, area, and surface.
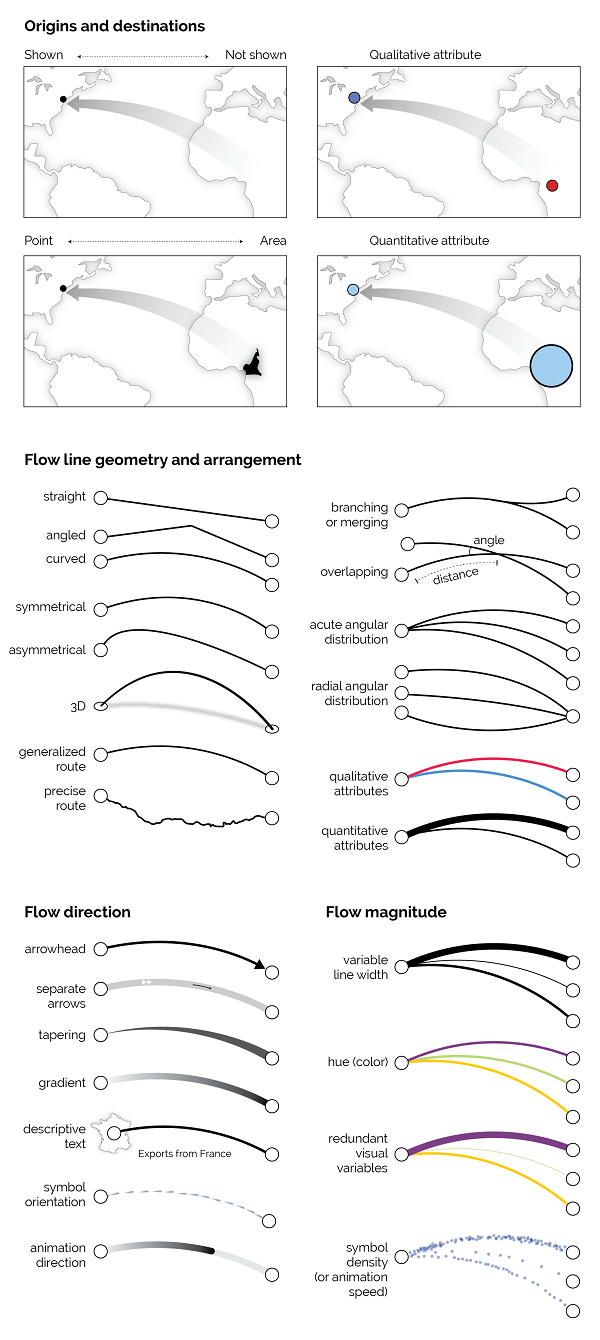
Flow Map Design Considerations
As you can see in Figure 5 beside, we need to take care of design considerations for making a Flow Map.
There are four important design cosiderations:
-Origins and Destinations
-Flow line geometry and arrangements-Flow direction
-Flow magnitude
Create a Flow Map
create freely, change your data and visual variable to see the difference affected by both
Data Description⬇️
will be shown once you select the data